Warren Buffett
2018 Annual Letter
--- Page 1 ---
Berkshire’s Performance vs. the S&P 500
Annual Percentage Change
Yearin Per-Share
Book Value of
Berkshirein Per-Share
Market Value of
Berkshirein S&P 500
with Dividends
Included
1965 ................................................. 23.8 49.5 10.0
1966 ................................................. 20.3 (3.4) (11.7)
1967 ................................................. 11.0 13.3 30.9
1968 ................................................. 19.0 77.8 11.0
1969 ................................................. 16.2 19.4 (8.4)
1970 ................................................. 12.0 (4.6) 3.9
1971 ................................................. 16.4 80.5 14.6
1972 ................................................. 21.7 8.1 18.9
1973 ................................................. 4 . 7 (2.5) (14.8)
1974 ................................................. 5 . 5 (48.7) (26.4)
1975 ................................................. 21.9 2.5 37.2
1976 ................................................. 59.3 129.3 23.6
1977 ................................................. 31.9 46.8 (7.4)
1978 ................................................. 24.0 14.5 6.4
1979 ................................................. 35.7 102.5 18.2
1980 ................................................. 19.3 32.8 32.3
1981 ................................................. 31.4 31.8 (5.0)
1982 ................................................. 40.0 38.4 21.4
1983 ................................................. 32.3 69.0 22.4
1984 ................................................. 13.6 (2.7) 6.1
1985 ................................................. 48.2 93.7 31.6
1986 ................................................. 26.1 14.2 18.6
1987 ................................................. 19.5 4.6 5.1
1988 ................................................. 20.1 59.3 16.6
1989 ................................................. 44.4 84.6 31.7
1990 ................................................. 7 . 4 (23.1) (3.1)
1991 ................................................. 39.6 35.6 30.5
1992 ................................................. 20.3 29.8 7.6
1993 ................................................. 14.3 38.9 10.1
1994 ................................................. 13.9 25.0 1.3
1995 ................................................. 43.1 57.4 37.6
1996 ................................................. 31.8 6.2 23.0
1997 ................................................. 34.1 34.9 33.4
1998 ................................................. 48.3 52.2 28.6
1999 ................................................. 0 . 5 (19.9) 21.0
2000 ................................................. 6 . 5 26.6 (9.1)
2001 ................................................. (6.2) 6.5 (11.9)
2002 ................................................. 10.0 (3.8) (22.1)
2003 ................................................. 21.0 15.8 28.7
2004 ................................................. 10.5 4.3 10.9
2005 ................................................. 6 . 4 0 . 8 4 . 9
2006 ................................................. 18.4 24.1 15.8
2007 ................................................. 11.0 28.7 5.5
2008 ................................................. (9.6) (31.8) (37.0)
2009 ................................................. 19.8 2.7 26.5
2010 ................................................. 13.0 21.4 15.1
2011 ................................................. 4 . 6 (4.7) 2.1
2012 ................................................. 14.4 16.8 16.0
2013 ................................................. 18.2 32.7 32.4
2014 ................................................. 8 . 3 27.0 13.7
2015 ................................................. 6 . 4 (12.5) 1.4
2016 ................................................. 10.7 23.4 12.0
2017 ................................................. 23.0 21.9 21.8
2018 ................................................. 0 . 4 2 . 8 (4.4)
Compounded Annual Gain – 1965-2018 ..................... 18.7% 20.5% 9.7%
Overall Gain – 1964-2018 ................................ 1,091,899% 2,472,627% 15,019%
Note: Data are for calendar years with these exceptions: 1965 and 1966, year e nded 9/30; 1967, 15 months ended 12/31. Starting in 1979, accounting rules
required insurance companies to value the equity securities they hold at mar ket rather than at the lower of cost or market, which was previously the req uirement.
In this table, Berkshire’s results through 1978 have been restated to confor m to the changed rules. In all other respects, the results are calculated u sing the
numbers originally reported. The S&P 500 numbers are pre-tax whereas the Berkshire numbers are after-tax . If a corporation such as Berkshire were simply
to have owned the S&P 500 and accrued the appropriate taxes, its results woul d have lagged the S&P 500 in years when that index showed a positive return,
but would have exceeded the S&P 500 in years when the index showed a negative r eturn. Over the years, the tax costs would have caused the aggregate lag to
be substantial.
2
--- Page 2 ---
BERKSHIRE HATHAWAY INC.
To the Shareholders of Berkshire Hathaway Inc.:
Berkshire earned $4.0 billion in 2018 utilizing generally accepted accounting principles (commonly called
“GAAP”). The components of that figure are $24.8 billion in operating earnings, a $3.0 billion non-cash loss from animpairment of intangible assets (arising almost entirely from our equity interest in Kraft Heinz), $2.8 billion in realizedcapital gains from the sale of investment securities and a $20.6 billion lossfrom a reduction in the amount of unrealized
capital gains that existed in our investment holdings.
A new GAAP rule requires us to include that last item in earnings. As I emphasized in the 2017 annual report,
neither Berkshire’s Vice Chairman, Charlie Munger, nor I believe that rule to be sensible. Rather, both of us haveconsistently thought that at Berkshire this mark-to-market change would produce what I described as “wild andcapricious swings in our bottom line.”
The accuracy of that prediction can be suggested by our quarterly results during 2018. In the first and fourth
quarters, we reported GAAP losses of $1.1 billion and $25.4 billion respectively. In the second and third quarters, we
reported profits of $12 billion and $18.5 billion. In complete contrast to these gyrations, the many businesses that
Berkshire owns delivered consistent and satisfactory operating earnings in allquarters. For the year, those earnings
exceeded their 2016 high of $17.6 billion by 41%.
Wide swings in our quarterly GAAP earnings will inevitably continue. That’s because our huge equity
portfolio – valued at nearly $173 billion at the end of 2018 – will often experience one-day price fluctuations of $2billion or more, all of which the new rule says must be dropped immediately to our bottom line. Indeed, in the fourthquarter, a period of high volatility in stock prices, we experienced several days with a “profit” or “loss” of more than$4 billion.
Our advice? Focus on operating earnings, paying little attention to gains or losses of any variety. My saying
that in no way diminishes the importance of our investments to Berkshire. Over time, Charlie and I expect them todeliver substantial gains, albeit with highly irregular timing.
************
Long-time readers of our annual reports will have spotted the different way in which I opened this letter. For
nearly three decades, the initial paragraph featured the percentage change in Berkshire’s per-share book value. It’snow time to abandon that practice.
The fact is that the annual change in Berkshire’s book value – which makes its farewell appearance on page
2 – is a metric that has lost the relevance it once had. Three circumstances have made that so. First, Berkshire hasgradually morphed from a company whose assets are concentrated in marketable stocks into one whose major valueresides in operating businesses. Charlie and I expect that reshaping to continue in an irregular manner. Second, whileourequity holdings are valued at market prices, accounting rules require our collection of operating companies to be
included in book value at an amount far below their current value, a mismark that has grown in recent years. Third, itis likely that – over time – Berkshire will be a significant repurchaser of its shares, transactions that will take place atprices above book value but below our estimate of intrinsic value. The math of such purchases is simple: Eachtransaction makes per-share intrinsic value go up, while per-share book value goes down. That combination causesthe book-value scorecard to become increasingly out of touch with economic reality.
3
--- Page 3 ---
In future tabulations of our financial results, we expect to focus on Berkshire’s market price. Markets can be
extremely capricious: Just look at the 54-year history laid out on page 2. Over time, however, Berkshire’s stock pricewill provide the best measure of business performance.
************
Before moving on, I want to give you some good news – really good news – that is not reflected in our
financial statements. It concerns the management changes we made in early 2018, when Ajit Jain was put in chargeof all insurance activities and Greg Abel was given authority over all other operations. These moves were overdue.Berkshire is now far better managed than when I alone was supervising operations. Ajit and Greg have rare talents,and Berkshire blood flows through their veins.
Now let’s take a look at what you own.
Focus on the Forest – Forget the Trees
Investors who evaluate Berkshire sometimes obsess on the details of our many and diverse businesses – our
economic “trees,” so to speak. Analysis of that type can be mind-numbing, given that we own a vast array ofspecimens, ranging from twigs to redwoods. A few of our trees are diseased and unlikely to be around a decade fromnow. Many others, though, are destined to grow in size and beauty.
Fortunately, it’s not necessary to evaluate each tree individually to make a rough estimate of Berkshire’s
intrinsic business value. That’s because our forest contains five “groves” of major importance, each of which can beappraised, with reasonable accuracy, in its entirety. Four of those groves are differentiated clusters of businesses andfinancial assets that are easy to understand. The fifth – our huge and diverse insurance operation – delivers great valueto Berkshire in a less obvious manner, one I will explain later in this letter.
Before we look more closely at the first four groves, let me remind you of our prime goal in the deployment
of your capital: to buy ably-managed businesses, in whole or part , that possess favorable and durable economic
characteristics. We also need to make these purchases at sensible prices.
Sometimes we can buy control of companies that meet our tests. Far more often, we find the attributes we
seek in publicly-traded businesses, in which we normally acquire a 5% to 10% interest. Our two-pronged approach tohuge-scale capital allocation is rare in corporate America and, at times, gives us an important advantage.
In recent years, the sensible course for us to follow has been clear: Many stocks have offered far more for
our money than we could obtain by purchasing businesses in their entirety. That disparity led us to buy about $43billion of marketable equities last year, while selling only $19 billion. Charlie and I believe the companies in whichwe invested offered excellent value, far exceeding that available in takeover transactions.
Despite our recent additions to marketable equities, the most valuable grove in Berkshire’s forest remains the
many dozens of non-insurance businesses that Berkshire controls (usually with 100% ownership and never with lessthan 80%). Those subsidiaries earned $16.8 billion last year. When we say “earned,” moreover, we are describing whatremains after allincome taxes, interest payments, managerial compensation (whether cash or stock-based),
restructuring expenses, depreciation, amortization and home-office overhead.
That brand of earnings is a far cry from that frequently touted by Wall Street bankers and corporate CEOs.
Too often, their presentations feature “adjusted EBITDA,” a measure that redefines “earnings” to exclude a variety ofall-too-real costs.
4
--- Page 4 ---
For example, managements sometimes assert that their company’s stock-based compensation shouldn’t be
counted as an expense. (What else could it be – a giftfrom shareholders?) And restructuring expenses? Well, maybe
last year’s exact rearrangement won’t recur. But restructurings of one sort or another are common in business –Berkshire has gone down that road dozens of times, and our shareholders have always borne the costs of doing so.
Abraham Lincoln once posed the question: “If you call a dog’s tail a leg, how many legs does it have?” and
then answered his own query: “Four, because calling a tail a leg doesn’t make it one.” Abe would have felt lonely onWall Street.
Charlie and I do contend that our acquisition-related amortization expenses of $1.4 billion (detailed on page
K-84) are not a true economic cost. We add back such amortization “costs” to GAAP earnings when we are evaluatingboth private businesses and marketable stocks.
In contrast, Berkshire’s $8.4 billion depreciation charge understates our true economic cost. In fact, we need
to spend more than this sum annually to simply remain competitive in our many operations. Beyond those
“maintenance” capital expenditures, we spend large sums in pursuit of growth. Overall, Berkshire invested a record$14.5 billion last year in plant, equipment and other fixed assets, with 89% of that spent in America.
Berkshire’s runner-up grove by value is its collection of equities, typically involving a 5% to 10% ownership
position in a very large company. As noted earlier, our equity investments were worth nearly $173 billion at yearend,an amount far above their cost. If the portfolio had been sold at its yearend valuation, federal income tax of about$14.7 billion would have been payable on the gain. In all likelihood, we will hold most of these stocks for a long time.Eventually, however, gains generate taxes at whatever rate prevails at the time of sale.
Our investees paid us dividends of $3.8 billion last year, a sum that will increase in 2019. Far more important
than the dividends, though, are the huge earnings that are annually retained by these companies. Consider, as anindicator, these figures that cover only our five largest holdings.
Yearend
Ownership
Berkshire’s Share in $ millions of
Company Dividends(1) Retained Earnings(2)
American Express 17.9% $ 237 $ 997
Apple 5.4% 745 2,502Bank of America 9.5% 551 2,096Coca-Cola 9.4% 624 (21)Wells Fargo 9.8% 809 1,263
Total $2,966 $6,837
(1) Based on current annual rate.(2) Based on 2018 earnings minus common and preferred dividends paid.
GAAP – which dictates the earnings we report – does not allow us to include the retained earnings of
investees in our financial accounts. But those earnings are of enormous value to us: Over the years, earnings retainedby our investees (viewed as a group) have eventually delivered capital gains to Berkshire that totaled more than onedollar for each dollar these companies reinvested for us.
All of our major holdings enjoy excellent economics, and most use a portion of their retained earnings to
repurchase their shares. We very much like that: If Charlie and I think an investee’s stock is underpriced, we rejoicewhen management employs some of its earnings to increase Berkshire’s ownership percentage.
5
--- Page 5 ---
Here’s one example drawn from the table above: Berkshire’s holdings of American Express have remained
unchanged over the past eight years. Meanwhile, our ownership increased from 12.6% to 17.9% because ofrepurchases made by the company. Last year, Berkshire’s portion of the $6.9 billion earned by American Express was$1.2 billion, about 96% of the $1.3 billion we paid for our stake in the company. When earnings increase and sharesoutstanding decrease, owners – over time – usually do well.
A third category of Berkshire’s business ownership is a quartet of companies in which we share control with
other parties. Our portion of the after-tax operating earnings of these businesses – 26.7% of Kraft Heinz, 50% ofBerkadia and Electric Transmission Texas, and 38.6% of Pilot Flying J – totaled about $1.3 billion in 2018.
In our fourth grove, Berkshire held $112 billion at yearend in U.S. Treasury bills and other cash equivalents,
and another $20 billion in miscellaneous fixed-income instruments. We consider a portion of that stash to beuntouchable, having pledged to always hold at least $20 billion in cash equivalents to guard against external calamities.We have also promised to avoid anyactivities that could threaten our maintaining that buffer.
Berkshire will forever remain a financial fortress. In managing, I will make expensive mistakes of
commission and will also miss many opportunities, some of which should have been obvious to me. At times, ourstock will tumble as investors flee from equities. But I will never risk getting caught short of cash.
In the years ahead, we hope to move much of our excess liquidity into businesses that Berkshire will
permanently own. The immediate prospects for that, however, are not good: Prices are sky-high for businessespossessing decent long-term prospects.
That disappointing reality means that 2019 will likely see us again expanding our holdings of marketable
equities. We continue, nevertheless, to hope for an elephant-sized acquisition. Even at our ages of 88 and 95 – I’m the
young one – that prospect is what causes my heart and Charlie’s to beat faster. (Just writing about the possibility of a
huge purchase has caused my pulse rate to soar.)
My expectation of more stock purchases is nota market call. Charlie and I have no idea as to how stocks will
behave next week or next year. Predictions of that sort have never been a part of our activities. Our thinking, rather,
is focused on calculating whether a portion of an attractive business is worth more than its market price.
************
I believe Berkshire’s intrinsic value can be approximate d by summing the values of our four asset-laden
groves and then subtracting an appropriate amount for taxes eventually payable on the sale of marketable securities.
You may ask whether an allowance should not also be made for the major tax costs Berkshire would incur if
we were to sell certain of our wholly-owned businesses. Forget that thought: It would be foolish for us to sell any ofour wonderful companies even if notax would be payable on its sale. Truly good businesses are exceptionally hard to
find. Selling any you are lucky enough to own makes no sense at all.
The interest cost on allof our debt has been deducted as an expense in calculating the earnings at Berkshire’s
non-insurance businesses. Beyond that, much of our ownership of the first four groves is financed by funds generatedfrom Berkshire’s fifth grove – a collection of exceptional insurance companies. We call those funds “float,” a sourceof financing that we expect to be cost-free – or maybe even better than that – over time. We will explain thecharacteristics of float later in this letter.
Finally, a point of key and lasting importance: Berkshire’s value is maximized by our having assembled the
five groves into a single entity. This arrangement allows us to seamlessly and objectively allocate major amounts ofcapital, eliminate enterprise risk, avoid insularity, fund assets at exceptionally low cost, occasionally take advantageof tax efficiencies, and minimize overhead.
At Berkshire, the whole is greater – considerably greater – than the sum of the parts.
6
--- Page 6 ---
Repurchases and Reporting
Earlier I mentioned that Berkshire will from time to time be repurchasing its own stock. Assuming that we
buy at a discount to Berkshire’s intrinsic value – which certainly will be our intention – repurchases will benefit boththose shareholders leaving the company and those who stay.
True, the upside from repurchases is very slight for those who are leaving. That’s because careful buying by
us will minimize any impact on Berkshire’s stock price. Nevertheless, there is some benefit to sellers in having an
extra buyer in the market.
For continuing shareholders, the advantage is obvious: If the market prices a departing partner’s interest at,
say, 90¢ on the dollar, continuing shareholders reap an increase in per-share intrinsic value with every repurchase bythe company. Obviously, repurchases should be price-sensitive: Blindly buying an overpriced stock is value-destructive, a fact lost on many promotional or ever-optimistic CEOs.
When a company says that it contemplates repurchases, it’s vital that all shareholder-partners be given the
information they need to make an intelligent estimate of value. Providing that information is what Charlie and I try todo in this report. We do not want a partner to sell shares back to the company because he or she has been misled orinadequately informed.
Some sellers, however, may disagree with our calculation of value and others may have found investments
that they consider more attractive than Berkshire shares. Some of that second group will be right: There areunquestionably many stocks that will deliver far greater gains than ours.
In addition, certain shareholders will simply decide it’s time for them or their families to become net
consumers rather than continuing to build capital. Charlie and I have no current interest in joining that group. Perhapswe will become big spenders in our old age.
************
For 54 years our managerial decisions at Berkshire have been made from the viewpoint of the shareholders
who are staying, not those who are leaving. Consequently, Charlie and I have never focused on current-quarter results.
Berkshire, in fact, may be the only company in the Fortune 500 that does not prepare monthly earnings reports
or balance sheets. I, of course, regularly view the monthly financial reports of most subsidiaries. But Charlie and Ilearn of Berkshire’s overall earnings and financial position only on a quarterly basis.
Furthermore, Berkshire has no company-wide budget (though many of our subsidiaries find one useful). Our
lack of such an instrument means that the parent company has never had a quarterly “number” to hit. Shunning the
use of this bogey sends an important message to our many managers, reinforcing the culture we prize.
Over the years, Charlie and I have seen all sorts of bad corporate behavior, both accounting and operational,
induced by the desire of management to meet Wall Street expectations. What starts as an “innocent” fudge in order tonot disappoint “the Street” – say, trade-loading at quarter-end, turning a blind eye to rising insurance losses, or drawingdown a “cookie-jar” reserve – can become the first step toward full-fledged fraud. Playing with the numbers “just thisonce” may well be the CEO’s intent; it’s seldom the end result. And if it’s okay for the boss to cheat a little, it’s easyfor subordinates to rationalize similar behavior.
At Berkshire, our audience is neither analysts nor commentators: Charlie and I are working for our
shareholder-partners. The numbers that flow up to us will be the ones we send on to you.
7
--- Page 7 ---
Non-Insurance Operations – From Lollipops to Locomotives
Let’s now look further at Berkshire’s most valuable grove – our collection of non-insurance businesses –
keeping in mind that we do not wish to unnecessarily hand our competitors information that might be useful to them.Additional details about individual operations can be found on pages K-5 – K-22 and pages K-40 – K-51.
Viewed as a group, these businesses earned pre-tax income in 2018 of $20.8 billion, a 24% increase over
2017. Acquisitions we made in 2018 delivered only a trivial amount of that gain.
I will stick with pre-tax figures in this discussion. But our after-tax gain in 2018 from these businesses was
fargreater – 47 %– thanks in large part to the cut in the corporate tax rate that became effective at the beginning of
that year. Let’s look at why the impact was so dramatic.
Begin with an economic reality: Like it or not, the U.S. Government “owns” an interest in Berkshire’s
earnings of a size determined by Congress. In effect, our country’s Treasury Department holds a special class of ourstock – call this holding the AA shares – that receives large “dividends” (that is, tax payments) from Berkshire. In2017, as in many years before, the corporate tax rate was 35%, which meant that the Treasury was doing very wellwith its AA shares. Indeed, the Treasury’s “stock,” which was paying nothing when we took over in 1965, had evolvedinto a holding that delivered billions of dollars annually to the federal government.
Last year, however, 40% of the government’s “ownership” (14/35
ths) was returned to Berkshire – free of
charge – when the corporate tax rate was reduced to 21%. Consequently, our “A” and “B” shareholders received amajor boost in the earnings attributable to their shares.
This happening materially increased the intrinsic value of the Berkshire shares you and I own. The same
dynamic, moreover, enhanced the intrinsic value of almost all of the stocks Berkshire holds.
Those are the headlines. But there are other factors to consider that tempered our gain. For example, the tax
benefits garnered by our large utility operation get passed along to its customers. Meanwhile, the tax rate applicableto the substantial dividends we receive from domestic corporations is little changed at about 13%. (This lower rate haslong been logical because our investees have already paid tax on the earnings that they pay to us.) Overall, however,the new law made our businesses and the stocks we own considerably more valuable.
Which suggests that we return to the performance of our non-insurance businesses. Our two towering redwoods
in this grove are BNSF and Berkshire Hathaway Energy (90.9% owned). Combined, they earned $9.3 billion before taxlast year, up 6% from 2017. You can read more about these businesses on pages K-5 – K-10 and pages K-40 – K-45.
Our next five non-insurance subsidiaries, as ranked by earnings (but presented here alphabetically), Clayton
Homes, International Metalworking, Lubrizol, Marmon and Precision Castparts, had aggregate pre-tax income in 2018of $6.4 billion, up from the $5.5 billion these companies earned in 2017.
The next five, similarly ranked and listed (Forest River, Johns Manville, MiTek, Shaw and TTI) earned $2.4
billion pre-tax last year, up from $2.1 billion in 2017.
The remaining non-insurance businesses that Berkshire owns – and there are many – had pre-tax income of
$3.6 billion in 2018 vs. $3.3 billion in 2017.
8
--- Page 8 ---
Insurance, “Float,” and the Funding of Berkshire
Our property/casualty (“P/C”) insurance business – our fifth grove – has been the engine propelling
Berkshire’s growth since 1967, the year we acquired National Indemnity and its sister company, National Fire &Marine, for $8.6 million. Today, National Indemnity is the largest property/casualty company in the world as measuredby net worth.
One reason we were attracted to the P/C business was the industry’s business model: P/C insurers receive
premiums upfront and pay claims later. In extreme cases, such as claims arising from exposure to asbestos, or severeworkplace accidents, payments can stretch over many decades.
This collect-now, pay-later model leaves P/C companies holding large sums – money we call “float” – that
will eventually go to others. Meanwhile, insurers get to invest this float for their own benefit. Though individualpolicies and claims come and go, the amount of float an insurer holds usually remains fairly stable in relation topremium volume. Consequently, as our business grows, so does our float. And how it has grown, as the following
table shows:
Year
Float (in millions)*
1970 $ 39
1980 2371990 1,6322000 27,8712010 65,8322018 122,732
* Includes float arising from life, annuity and health insurance businesses .
We may in time experience a decline in float. If so, the decline will be very gradual – at the outside no more
than 3% in any year. The nature of our insurance contracts is such that we can never be subject to immediate or near-
term demands for sums that are of significance to our cash resources. That structure is by design and is a keycomponent in the unequaled financial strength of our insurance companies. That strength will never be compromised.
If our premiums exceed the total of our expenses and eventual losses, our insurance operation registers an
underwriting profit that adds to the investment income the float produces. When such a profit is earned, we enjoy theuse of free money – and, better yet, get paid for holding it.
Unfortunately, the wish of all insurers to achieve this happy result creates intense competition, so vigorous
indeed that it sometimes causes the P/C industry as a whole to operate at a significant underwriting loss. That loss, in
effect, is what the industry pays to hold its float. Competitive dynamics almost guarantee that the insurance industry,despite the float income all its companies enjoy, will continue its dismal record of earning subnormal returns ontangible net worth as compared to other American businesses.
Nevertheless, I like our own prospects. Berkshire’s unrivaled financial strength allows us far more flexibility
in investing our float than that generally available to P/C companies. The many alternatives available to us are alwaysan advantage and occasionally offer major opportunities. When other insurers are constrained, our choices expand.
Moreover, our P/C companies have an excellent underwriting record. Berkshire has now operated at an
underwriting profit for 15 of the past 16 years, the exception being 2017, when our pre-tax loss was $3.2 billion. Forthe entire 16-year span, our pre-tax gain totaled $27 billion, of which $2 billion was recorded in 2018.
9
--- Page 9 ---
That record is no accident: Disciplined risk evaluation is the daily focus of our insurance managers, who
know that the benefits of float can be drowned by poor underwriting results. All insurers give that message lip service.At Berkshire it is a religion, Old Testament style.
************
In most cases, the funding of a business comes from two sources – debt and equity. At Berkshire, we have
two additional arrows in the quiver to talk about, but let’s first address the conventional components.
We use debt sparingly. Many managers, it should be noted, will disagree with this policy, arguing that
significant debt juices the returns for equity owners. And these more venturesome CEOs will be right most of the time.
At rare and unpredictable intervals, however, credit vanishes and debt becomes financially fatal. A Russian-
roulette equation – usually win, occasionally die – may make financial sense for someone who gets a piece of acompany’s upside but does not share in its downside. But that strategy would be madness for Berkshire. Rationalpeople don’t risk what they have and need for what they don’t have and don’t need.
Most of the debt you see on our consolidated balance sheet – see page K-65 – resides at our railroad and
energy subsidiaries, both of them asset-heavy companies. During recessions, the cash generation of these businessesremains bountiful. The debt they use is both appropriate for their operations and notguaranteed by Berkshire.
Our level of equity capital is a different story: Berkshire’s $349 billion is unmatched in corporate America. By
retaining all earnings for a very long time, and allowing compound interest to work its magic, we have amassed fundsthat have enabled us to purchase and develop the valuable groves earlier described. Had we instead followed a 100%payout policy, we would still be working with the $22 million with which we began fiscal 1965.
Beyond using debt and equity, Berkshire has benefitted in a major way from two less-common sources of
corporate funding. The larger is the float I have described. So far, those funds, though they are recorded as a huge netliability on our balance sheet, have been of more utility to us than an equivalent amount of equity. That’s because they
have usually been accompanied by underwriting earnings. In effect, we have been paid in most years for holding and
using other people’s money.
As I have often done before, I will emphasize that this happy outcome is far from a sure thing: Mistakes in
assessing insurance risks can be huge and can take many years to surface. (Think asbestos.) A major catastrophe thatwill dwarf hurricanes Katrina and Michael willoccur – perhaps tomorrow, perhaps many decades from now. “The
Big One” may come from a traditional source, such as a hurricane or earthquake, or it may be a total surprise involving,say, a cyber attack having disastrous consequences beyond anything insurers now contemplate. When such a mega-catastrophe strikes, we will get our share of the losses and they will be big – very big. Unlike many other insurers,
however, we will be looking to add business the next day.
The final funding source – which again Berkshire possesses to an unusual degree – is deferred income taxes.
These are liabilities that we will eventually pay but that are meanwhile interest-free.
As I indicated earlier, about $14.7 billion of our $50.5 billion of deferred taxes arises from the unrealized
gains in our equity holdings. These liabilities are accrued in our financial statements at the current 21% corporate taxrate but will be paid at the rates prevailing when our investments are sold. Between now and then, we in effect havean interest-free “loan” that allows us to have more money working for us in equities than would otherwise be the case.
10
--- Page 10 ---
A further $28.3 billion of deferred tax results from our being able to accelerate the depreciation of assets such
as plant and equipment in calculating the tax we must currently pay. The front-ended savings in taxes that we recordgradually reverse in future years. We regularly purchase additional assets, however. As long as the present tax lawprevails, this source of funding should trend upward.
Over time, Berkshire’s funding base – that’s the right-hand side of our balance sheet – should grow, primarily
through the earnings we retain. Our job is to put the money retained to good use on the left-hand side, by addingattractive assets.
GEICO and Tony Nicely
That title says it all: The company and the man are inseparable.Tony joined GEICO in 1961 at the age of 18; I met him in the mid-1970s. At that time, GEICO, after a four-
decade record of both rapid growth and outstanding underwriting results, suddenly found itself near bankruptcy. Arecently-installed management had grossly underestimated GEICO’s loss costs and consequently underpriced itsproduct. It would take many months until those loss-generating policies on GEICO’s books – there were no less than2.3 million of them – would expire and could then be repriced. The company’s net worth in the meantime was rapidlyapproaching zero.
In 1976, Jack Byrne was brought in as CEO to rescue GEICO. Soon after his arrival, I met him, concluded
that he was the perfect man for the job, and began to aggressively buy GEICO shares. Within a few months, Berkshirebought about
1⁄3of the company, a portion that later grew to roughly1⁄2without our spending a dime. That stunning
accretion occurred because GEICO, after recovering its health, consistently repurchased its shares. All told, this half-interest in GEICO cost Berkshire $47 million, about what you might pay today for a trophy apartment in New York.
Let’s now fast-forward 17 years to 1993, when Tony Nicely was promoted to CEO. At that point, GEICO’s
reputation and profitability had been restored – but not its growth. Indeed, at yearend 1992 the company had only 1.9million auto policies on its books, far less than its pre-crisis high. In sales volume among U.S. auto insurers, GEICOthen ranked an undistinguished seventh.
Late in 1995, after Tony had re-energized GEICO, Berkshire made an offer to buy the remaining 50% of the
company for $2.3 billion, about 50 times what we had paid for the first half (and people say I never pay up!). Ouroffer was successful and brought Berkshire a wonderful, but underdeveloped, company and an equally wonderfulCEO, who would move GEICO forward beyond my dreams.
GEICO is now America’s Number Two auto insurer, with sales 1,200% greater than it recorded in 1995.
Underwriting profits have totaled $15.5 billion (pre-tax) since our purchase, and float available for investment hasgrown from $2.5 billion to $22.1 billion.
By my estimate, Tony’s management of GEICO has increased Berkshire’s intrinsic value by more than $50
billion. On top of that, he is a model for everything a manager should be, helping his 40,000 associates to identify andpolish abilities they didn’t realize they possessed.
Last year, Tony decided to retire as CEO, and on June 30
thhe turned that position over to Bill Roberts, his
long-time partner. I’ve known and watched Bill operate for several decades, and once again Tony made the rightmove. Tony remains Chairman and will be helpful to GEICO for the rest of his life. He’s incapable of doing less.
AllBerkshire shareholders owe Tony their thanks. Ihead the list.
11
--- Page 11 ---
Investments
Below we list our fifteen common stock investments that at yearend had the largest market value. We exclude
our Kraft Heinz holding – 325,442,152 shares – because Berkshire is part of a control group and therefore mustaccount for this investment on the “equity” method. On its balance sheet, Berkshire carries its Kraft Heinz holding ata GAAP figure of $13.8 billion, an amount reduced by our share of the large write-off of intangible assets taken byKraft Heinz in 2018. At yearend, our Kraft Heinz holding had a market value of $14 billion and a cost basis of$9.8 billion.
12/31/18
Shares* CompanyPercentage of
Company
Owned Cost** Market
(in millions)
151,610,700 American Express Company ................. 17.9 $ 1,287 $ 14,452
255,300,329 Apple Inc. ................................ 5 . 4 36,044 40,271
918,919,000 Bank of America Corp. ...................... 9 . 5 11,650 22,642
84,488,751 The Bank of New York Mellon Corp. .......... 8 . 8 3,860 3,977
6,789,054 Charter Communications, Inc. ................ 3 . 0 1,210 1,935
400,000,000 The Coca-Cola Company .................... 9 . 4 1,299 18,940
65,535,000 Delta Air Lines, Inc. ........................ 9 . 6 2,860 3,270
18,784,698 The Goldman Sachs Group, Inc. .............. 4 . 9 2,380 3,138
50,661,394 JPMorgan Chase & Co. ..................... 1 . 5 5,605 4,946
24,669,778 Moody’s Corporation ....................... 12.9 248 3,455
47,890,899 Southwest Airlines Co. ...................... 8 . 7 2,005 2,226
21,938,642 United Continental Holdings Inc. .............. 8 . 1 1,195 1,837
146,346,999 U.S. Bancorp ............................. 9 . 1 5,548 6,688
43,387,980 USG Corporation .......................... 31.0 836 1,851
449,349,102 Wells Fargo & Company .................... 9 . 8 10,639 20,706
Others ................................... 16,201 22,423
Total Common Stocks Carried at Market ........ $ 102,867 $ 172,757
* Excludes shares held by pension funds of Berkshire subsidiaries.
** This is our actual purchase price and also our tax basis.
Charlie and I do notview the $172.8 billion detailed above as a collection of ticker symbols – a financial
dalliance to be terminated because of downgrades by “the Street,” expected Federal Reserve actions, possible politicaldevelopments, forecasts by economists or whatever else might be the subject du jour .
What we see in our holdings, rather, is an assembly of companies that we partly own and that, on a weighted
basis, are earning about 20% on the net tangible equity capital required to run their businesses. These companies, also,
earn their profits without employing excessive levels of debt.
12
--- Page 12 ---
Returns of that order by large, established and understandable businesses are remarkable under any
circumstances. They are truly mind-blowing when compared against the return that many investors have accepted onbonds over the last decade – 3% or less on 30-year U.S. Treasury bonds, for example.
On occasion, a ridiculously-high purchase price for a given stock will cause a splendid business to become a
poor investment – if not permanently, at least for a painfully long period. Over time, however, investment performanceconverges with business performance. And, as I will next spell out, the record of American business has beenextraordinary.
The American Tailwind
On March 11
th, it will be 77 years since I first invested in an American business. The year was 1942, I was
11, and I went all in, investing $114.75 I had begun accumulating at age six. What I bought was three shares of CitiesService preferred stock. I had become a capitalist, and it felt good.
Let’s now travel back through the two 77-year periods that preceded my purchase. That leaves us starting in
1788, a year prior to George Washington’s installation as our first president. Could anyone then have imagined whattheir new country would accomplish in only three 77-year lifetimes?
During the two 77-year periods prior to 1942, the United States had grown from four million people – about
1⁄2of 1% of the world’s population – into the most powerful country on earth. In that spring of 1942, though, it faced
a crisis: The U.S. and its allies were suffering heavy losses in a war that we had entered only three months earlier. Badnews arrived daily.
Despite the alarming headlines, almost all Americans believed on that March 11
ththat the war would be
won. Nor was their optimism limited to that victory. Leaving aside congenital pessimists, Americans believed thattheir children and generations beyond would live far better lives than they themselves had led.
The nation’s citizens understood, of course, that the road ahead would not be a smooth ride. It never had
been. Early in its history our country was tested by a Civil War that killed 4% of all American males and led PresidentLincoln to openly ponder whether “a nation so conceived and so dedicated could long endure.” In the 1930s, Americasuffered through the Great Depression, a punishing period of massive unemployment.
Nevertheless, in 1942, when I made my purchase, the nation expected post-war growth, a belief that proved
to be well-founded. In fact, the nation’s achievements can best be described as breathtaking.
Let’s put numbers to that claim: If my $114.75 had been invested in a no-fee S&P 500 index fund, and all
dividends had been reinvested, my stake would have grown to be worth (pre-taxes) $606,811 on January 31, 2019 (thelatest data available before the printing of this letter). That is a gain of 5,288 for 1. Meanwhile, a $1 million investment
by a tax-free institution of that time – say, a pension fund or college endowment – would have grown to about $5.3billion .
Let me add one additional calculation that I believe will shock you: If that hypothetical institution had paid
only 1%of assets annually to various “helpers,” such as investment managers and consultants, its gain would have
been cut in half , to $2.65 billion. That’s what happens over 77 years when the 11.8% annual return actually achieved
by the S&P 500 is recalculated at a 10.8% rate.
13
--- Page 13 ---
Those who regularly preach doom because of government budget deficits (as I regularly did myself for many
years) might note that our country’s national debt has increased roughly 400-fold during the last of my 77-year periods.That’s 40,000%! Suppose you had foreseen this increase and panicked at the prospect of runaway deficits and aworthless currency. To “protect” yourself, you might have eschewed stocks and opted instead to buy 3
1⁄4ounces of
gold with your $114.75.
And what would that supposed protection have delivered? You would now have an asset worth about $4,200,
less than 1% of what would have been realized from a simple unmanaged investment in American business. The
magical metal was no match for the American mettle.
Our country’s almost unbelievable prosperity has been gained in a bipartisan manner. Since 1942, we have
had seven Republican presidents and seven Democrats. In the years they served, the country contended at various timeswith a long period of viral inflation, a 21% prime rate, several controversial and costly wars, the resignation of apresident, a pervasive collapse in home values, a paralyzing financial panic and a host of other problems. Allengendered scary headlines; all are now history.
Christopher Wren, architect of St. Paul’s Cathedral, lies buried within that London church. Near his tomb are
posted these words of description (translated from Latin): “If you would seek my monument, look around you.” Thoseskeptical of America’s economic playbook should heed his message.
In 1788 – to go back to our starting point – there really wasn’t much here except for a small band of ambitious
people and an embryonic governing framework aimed at turning their dreams into reality. Today, the Federal Reserveestimates our household wealth at $108 trillion , an amount almost impossible to comprehend.
Remember, earlier in this letter, how I described retained earnings as having been the key to Berkshire’s
prosperity? So it has been with America. In the nation’s accounting, the comparable item is labeled “savings.” Andsave we have. If our forefathers had instead consumed all they produced, there would have been no investment, noproductivity gains and no leap in living standards.
************
Charlie and I happily acknowledge that much of Berkshire’s success has simply been a product of what I
think should be called The American Tailwind . It is beyond arrogance for American businesses or individuals to boast
that they have “done it alone.” The tidy rows of simple white crosses at Normandy should shame those who makesuch claims.
There are also many other countries around the world that have bright futures. About that, we should rejoice:
Americans will be both more prosperous and safer if allnations thrive. At Berkshire, we hope to invest significant
sums across borders.
Over the next 77 years, however, the major source of our gains will almost certainly be provided by The
American Tailwind. We are lucky – gloriously lucky – to have that force at our back.
14
--- Page 14 ---
The Annual Meeting
Berkshire’s 2019 annual meeting will take place on Saturday, May 4th. If you are thinking about attending –
and Charlie and I hope you come – check out the details on pages A-2 – A-3. They describe the same schedule we’vefollowed for some years.
If you can’t join us in Omaha, attend via Yahoo’s webcast. Andy Serwer and his Yahoo associates do an
outstanding job, both in covering the entire meeting and interviewing many Berkshire managers, celebrities, financialexperts and shareholders from the U.S. and abroad. The world’s knowledge of what goes on in Omaha the firstSaturday of every May has grown dramatically since Yahoo came on board. Its coverage begins at 8:45 a.m. CDT andprovides Mandarin translation.
************
For 54 years, Charlie and I have loved our jobs. Daily, we do what we find interesting, working with people
we like and trust. And now our new management structure has made our lives even more enjoyable.
With the whole ensemble – that is, with Ajit and Greg running operations, a great collection of businesses, a
Niagara of cash-generation, a cadre of talented managers and a rock-solid culture – your company is in good shapefor whatever the future brings.
February 23, 2019 Warren E. Buffett
Chairman of the Board
15
Recommended Reading
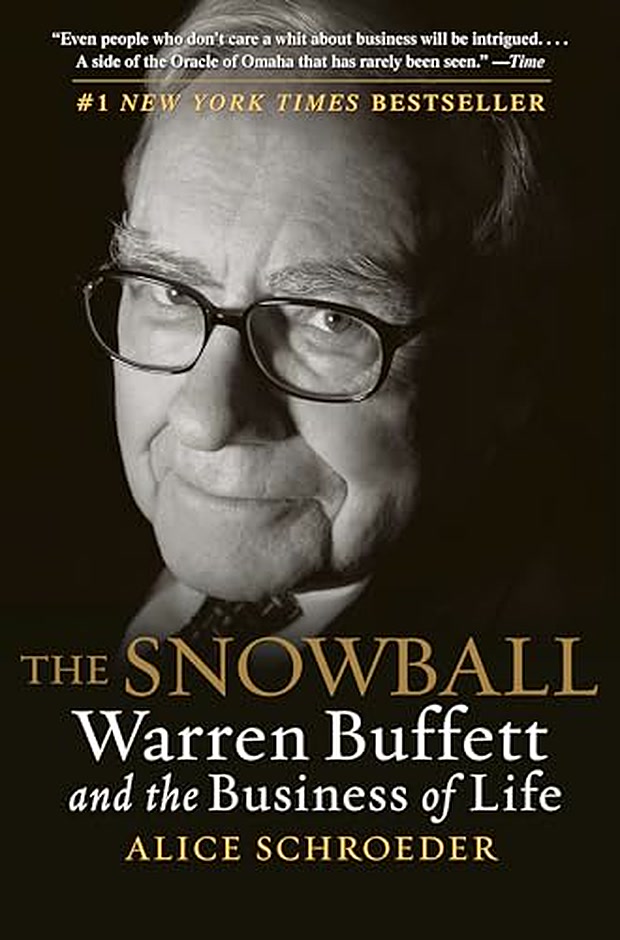
The Snowball
Get on Amazon →

The Essays of Warren Buffett
Get on Amazon →
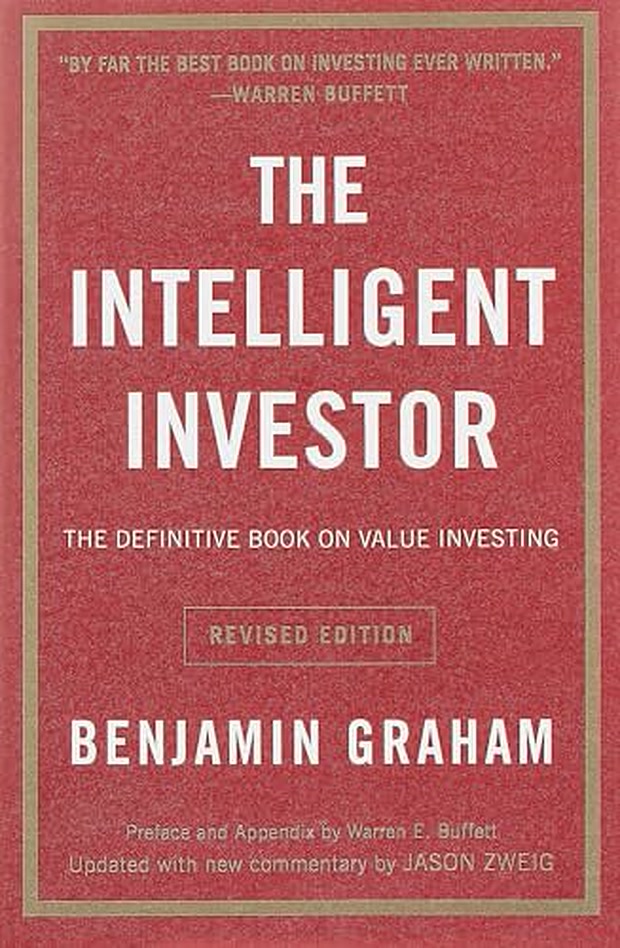
The Intelligent Investor
Get on Amazon →
As an Amazon Associate I earn from qualifying purchases.