Howard Marks
2004 07 21 The Happy Medium
© Oaktree Capital Management, L.P.
All Rights ReservedMemo to: Oaktree Clients
From: Howard Marks
Re: The Happy Medium
My second general memo to clients was dated April 11, 1991 and imaginatively titled “First Quarter
Performance.” It primarily discussed the swing of the market pendulum. I may be biased, but I’m
pleased with what it says and, thirteen years later, wouldn’t change a word.
The mood swings of the securities markets resemble the movement of a pendulum.
Although the midpoint of its arc best describes the location of the pendulum “on
average,” it actually spends very little of its time there. Instead, it is almost always
swinging toward or away from the extremes of its arc. But whenever the pendulum
is near either extreme, it is inevitable that it will move back toward the midpoint sooner or later. In fact, it is the movement toward the extreme itself that supplies the
energy for the swing back.
Investment markets make the same pendulum-like swing:
between euphoria and depression,
between celebrating positive developments and obsessing over negatives,
and thus
between overpriced and underpriced.
This oscillation is one of the most dependable features of the investment world, and
investor psychology seems to spend much more time at the extremes than it
does at the “happy medium.” (Emphasis added)
Although I’ve learned a great deal in the time since that memo was published, I still think the
paragraphs excerpted above capture almost the entire essence of market movements.
I continue to believe that cycles are inevitable, often profound, and the most reliable feature of
the business and investment worlds . In November 2001 I wrote a memo on this subject entitled
“You Can’t Predict. You Can Prepare.” (It didn’t generate any reader reaction, even though I
thought its contents were important.) The memo discussed some of the cycles that affect the
investor:
The economic cycle evidences moderate fluctuations (although their impact can be profound).
Viewed on a long-term graph, it looks like a gentle wave.
The business cycle responds to developments in the economy with a more pronounced effect ,
rising and falling as consumers and businesse s loosen and tighten their purse strings.
The profits cycle reflects an exaggerated reaction to changes in the amount of business
companies are doing, primarily because of the twin influences of operating leverage (such that
© Oaktree Capital Management, L.P.
All Rights Reservedoperating profits change m o
re than revenues) and financial leverage (such that net income
changes more than operating profits).
The credit cycle moves dramatically , usually oscillating between periods when the capital
markets are wide open and periods when they’re slammed shut.
The market cycle reacts violently, as investor psychology magnifies all of the above. Security
prices yo-yo in what can often be described as extreme over-reaction.
Everyone’s aware of these cycles and their influence on the markets, but it’s important that their essence and origin be thoroughly understood. For me that means delving into human nature and
emotion. The theme of this memo will be that the cyclical phenomena that so heavily influence
our investment outcomes aren’t caused by the operation of institutions or physical laws.
Rather, they largely result from people’s frailties and excesses . A thorough understanding of
these things can increase an investor’s ability to achieve gains and avoid losses.
1BUGreed or Fear
When I was a rookie analyst, we heard all the time that “the stock market is driven by greed and fear.” When the market environment is in healthy balance, a tug-of-war takes place between
optimists intent on making money and pessimists seeking to avoid losses. The former want to buy
stocks, even if they have to pay a price a bit above yesterday’s close, and the latter want to sell
them, even if it’s on a downtick.
When the market doesn’t go anyplace, it’s because the sentiment behind this tug-of-war is evenly
divided, and the people – or feelings – on the two ends of the rope carry roughly equal weight. The optimists may prevail for a while, but as securities are bid up they become more highly priced, and
then the pessimists gain sway and sell them down. The result is a market that rises or falls
moderately if at all – not unlike the experience so far this year. For example, as The Wall Street
Journal wrote on May 17,
The Dow Jones Industrial Average has been down for three weeks in a row, . . . Still, a determined group of optimists has refused to throw in the towel, stepping in
to buy what they view as cheap stocks whenever prices began to plummet. On Wednesday, when the Dow Industrials fell as low as 9852.19 during the day, these
people began to buy, pushing the blue-chip average back above 10000.
Two forces continue to compete in the market: those who believe that the current
skittishness will end once investors get used to the idea of rising interest rates, and those who think further stock declines are inevitable.
It didn’t take long in my early days, however, for me to realize that often the market is driven by
greed
Uor U fear. At the times that really count, large numbers of people leave one end of the rope for
the other. Either the greedy or the fearful predominate, and they move the market dramatically.
When there’s only greed and no fear, for example, everyone wants to buy, no one wants to sell,
and few people can think of reasons why prices shouldn’t rise. And so they do – often in leaps
and bounds and with no apparent governor.
© Oaktree Capital Management, L.P.
All Rights Reserved
Clearly that ’s what happe
ned to tech stocks in 1999. Greed was the dominant characteristic of that
market. Those who weren’t participating were forced to watch everyone else get rich. “Prudent investors” were rewarded with a feeling of stupidity. The buyers moving that market felt no fear.
“There’s a new paradigm,” was the battle cry, “get on board before you miss the boat. And by the
way, the price I’m buying at can’t be excessive, because the market’s always efficient.” Everyone perceived a virtuous cycle in favor of tech stocks to which there could be no end.
But eventually, something changes. Either a stumbling block materializes, or a prominent
company reports a problem, or an exogenous factor intrudes. Prices can even fall under their
own weight or based on a downturn in psychology with no obvious cause . Certainly no one I
know can say exactly what it was that burst the tech stock bubble in 2000. But somehow the greed
evaporated and fear took over. “Buy before you miss out” was replaced by “Sell before it goes to
zero.”
And thus fear comes into the ascendancy. Pe ople don’t worry about missing opportunities;
they worry about losing money. Irrational exuberance is replaced by excessive caution. Whereas
in 1999 pie-in-the-sky forecasts for a decade out were embraced warmly, in 2002 investors
chastened by the corporate scandals said, “I’ll never trust management again” and “How can I be sure any financial statements are accurate?” Thus almost no one wanted to buy the bonds of the
scandal-plagued companies, for example, and they sunk to giveaway prices. It’s from the
extremes of the cycle of fear and greed that aris e the greatest investment profits, as distressed
debt demonstrated last year.
0BURisk Tolerance or Risk Aversion
In my opinion, the greed/fear cycle is ca used by changing attitudes toward risk. When
greed is prevalent, it means investors feel a high level of comfort with risk and the idea
of bearing it in the interest of profit. Conversely, widespread fear indicates a high level
of aversion to risk . The academics consider investors’ attitude toward risk a constant, but
certainly it fluctuates greatly.
Finance theory is heavily dependent on the as sumption that investors are risk-averse.
That is, they “disprefer” risk and must be induced – bribed – to bear it. That’s the
reason why the capital market line slopes upward to the right: investors have to be offered higher expected returns in order to induce them to make investments entailing higher risk.
Of course, these higher returns can’t be a sure thing, because in that case the investments
wouldn’t actually be riskier. So the higher expected returns have to be accompanied by greater uncertainty (a broader dispersion of possible outcomes) or higher actual risk of
losing money.
But there are times when investors ignore th e uncertainty and risk of loss associated
with higher possible returns and pursue them too avidly. In 1996, I asked a consultant
why his firm was one of the few that didn’t recommend Oaktree’s high yield bond
management. His answer was simple: “We’re tr ying to maximize risk, and we can’t do that
with you.” Of course, that answer was shorthand for something that made a little more
sense: that in theory the way to increase return is to bear more risk, and he thought Oaktree’s
© Oaktree Capital Management, L.P.
All Rights Reservedportfolios didn ’
t contain enough risk to be top performers. In other words, he was saying,
“risk is our friend.”
It just can’t work that way! Dependably high returns from risky investments are an
oxymoron. But there are times when this caveat is ignored; when people get too
comfortable with risk; and thus when secu rities prices incorporate a premium for
bearing risk that is inadequate to co mpensate for the risk that’s present.
The prevalence of risk-tolerance (or risk-obliviousness) in the late 1990s was clear. I
personally heard a prominent brokerage house strategist say, “Stocks are overpriced, but not
enough to keep them from being a buy.” And we all heard the man on the street say “I’m up so much in my 401(k), it wouldn’t bother me if it fell by a third.” (Where was that guy two
or three years later?)
No, those risk-tolerant attitudes will not persist forever. Eventually, something will
intrude, exposing securities’ imperfections and too-high prices. Prices will decline.
Investors will like them less at $60 than they did at $100. Fear of losing the remaining $60
will overtake the urge to make back the lost $40. Risk aversion eventually will reassert
itself (and usually go to excess).
How about some quantification of this cycle? In mid-1998, just before the collapse of Long-
Term Capital Management brought investors other than techies to their senses, only $12.5
billion of non-defaulted bonds yielded more than 20% (one possible threshold for the label
“distressed debt”). Because investors weren’t very worried about risk, they demanded ultra-
high returns from relatively few non-defaulted bonds; the word “blithe” might best describe
their attitude.
But Long-Term’s demise awakened investors to the existence of risk, and a year later, the
amount of bonds yielding more than 20% had more than tripled to $38.7 billion. By mid-
2002, when the corporate scandals held the debt market in a grip of terror, the 20% yielders had grown to $105.6 billion , eight and a half times the level just four years earlier. Risk
aversion had come a long way from inadequate and, as later events showed, had become
excessive. By March 31, 2004, this figure had fallen 85%, to just $16.2 billion ; risk
aversion had subsided (and possibly had become inadequate again). I’m sure that fundamentals didn’t fluctuate anywhere near the degree reflected in prices, yields and thus
the distressed debt tally. As usual, reality wa s greatly exaggerated by swings in psychology.
When investors in general are too risk-tolerant, security prices can embody more risk than they do
return. When investors are too risk-averse, prices can offer more return than risk. For me, Warren
Buffett’s quote best sums up this phenomenon and the contrarian position that is required as a result:
“The less prudence with which others conduct their affairs, the greater the prudence with
which we should conduct our own affairs.”
2BUFull or Empty
One of the most volatile cycles relates to the willingness of investors to interpret events
positively or negatively. Forget the traditional half measures; investors see their glass
completely full at some times and totally empty at others.
© Oaktree Capital Management, L.P.
All Rights Reserved
It isn ’t
nonsensical for assets to be viewed differently at different times. After all, almost everything
incorporates elements of both good and bad. But there are times when investors seem to look only
at the positives or only at the negatives. As a result, there are times when there seems to be no
price so high that investors won’t pay it, and these inevitably are followed by times when no
price is low enough to convince people to buy.
This oscillation – from viewing a security, a company or an investment technique as “flawless” to
viewing it as “worthless” – has occurred several times during my time in the investment business,
with the predictable effect on prices. This “full-or-empty” phenomenon is particularly apparent in media savants’ explanations for each
day’s market movement. In “up” times, a strong report on consumer income is interpreted as
fueling corporate sales and profits, and thus is used to explain rising stock prices. In “down” times,
on the other hand, the same report may be cited as a cause of inflationary pressure, rising interest
rates, lower p/e ratios, and thus declining stock prices.
UValuing the Future – Credence or Skepticism
Some investors spend their time working hard to quantify this year’s earnings and the growth
thereafter. Others strive to value real assets, intellectual property and business advantages (and
predict what others will pay for them). Still othe rs try to deduce the value implications of mergers
and acquisitions, balance sheet restructurings and private-to-public transactions. In all of these
ways and many more, it’s the job of those in the investment business to predict the future and put a value on it.
In 2000-01, our distressed debt funds invested a few hundred million dollars in bankrupt telecom
companies. In each case, the purchase price implied a value for the company that was a small
© Oaktree Capital Management, L.P.
All Rights Reservedfraction of the amounts that had been invested in ha rd assets
such as switching gear or fiber-optic
cable. If we could resell the equipment for a higher percentage of its cost than we had paid, the
investment would be profitable.
The first sale went well, and we made a quick 50%. But soon thereafter, people stopped showing up
to bid on these assets. Whereas the party to whom we had sold the first company thought he had a bargain, in later instances the possible buyers shied away from assets that were turning out to be in
heavy oversupply. And that brings me to my point. In 1999, investors accepted at face value their
telecom companies’ rosy predictions of the future and paid handily for that potential. In 2001, they
saw the potential as largely empty and wouldn’t pay a dime for it, given that the industry’s capacity
vastly exceeded its current needs and no one could imagine the excess being absorbed in their lifetime. This cycle in investors’ willingness to value the future is one of the most powerful
that exists.
A simple metaphor relating to real estate helped me to understand this phenomenon: What’s an
empty building worth? An empty building (a) has a replacement value, of course, but it (b) throws
off no revenues and (c) costs money to own, in the form of taxes, insurance, minimum maintenance, interest payments, and opportunity costs. In other words, it’s a cash drain. When investors are in a
pessimistic mood and can’t see more than a few years out, they can only think about the negative
cash flows and are unable to imagine a time when the building will be rented and profitable. But
when the mood turns up and interest in future potential runs high, investors envision it full of tenants, throwing off vast amounts of cash, and thus salable at a fancy price.
Fluctuation in investors’ willingness to ascribe value to possible future developments represents a
variation on the full-or-empty cycle. Its swings are enormously powerful and mustn’t be
underestimated.
UValue Investing vs. Growth Investing – (or Value Today vs. Value Tomorrow)
Interest in “value investing” versus “growth investing” is another phenomenon that fluctuates over time, with the relative popularity of growth investing based heavily on investors’ willingness to
value the future. It’s not just a random fad, but a reflection of a cycle in attitudes.
In my view, all investors try to buy value – that is, to buy something for less than it’ll turn out to be
worth. The difference between the two principal schools of investing can be boiled down to this:
“Value investors” buy stocks (even those whose intrinsic value may show little growth in the future) out of conviction that the current value is high relative to the
current price.
“Growth investors” buy stocks (even those whose current value is low relative to their current price) because they believe the value will grow fast enough in the future
to produce substantial appreciation.
Thus, it seems to me, the choice isn’t rea lly between value and growth, but between
value today and value tomorrow. Growth investing represents a bet on company
performance that may or may not materialize in the future, while value investing is based
primarily on analysis of a company’s current worth.
© Oaktree Capital Management, L.P.
All Rights Reserved
Certainly m uch of the fluc
tuation in the performance of one school versus the other stems
from their relative price attractiveness: one group of stocks may be perceived as the cheaper of the two and thus begin to be bought more strongly. This buying makes it appreciate
relative to the other until it gets ahead price-wise, and then it declines (or at least pauses)
while the other catches up.
But the two schools’ relative performance also depends to a great extent on attitudes that
fluctuate cyclically. Optimistic growth investors with big dreams for the future bid up the
stocks of companies that they expect to exhibit rapid growth, as they did in 1998-99.
Eventually their buying power is spent, their hopes are dashed, or their optimism wanes. Then value investors with their more limited expectations regarding the future have their day
in less buoyant times, as they did in 2000-01.
USelling Panic (and Its Less-Recognized Brother)
As the pendulum makes its periodic swing from positive to negative, the resurgence of fear,
risk aversion, and attention to things missing from the glass combine to bring down prices.
Most investors see their resolve evaporate, along with all their reasons for holding the things
in their portfolios. They go from being confident partisans, to worriers, eventually to sellers
– and sometimes to panic sellers.
In November 2000, I wrote about “A Framework for Understanding Market Crisis,” an
insightful article by Richard Bookstaber, then of Moore Capital Management, that analyzed
the behavior of panic sellers. Rather than reinvent the wheel, I’ll excerpt from my earlier memo:
Most people think security price movements result primarily from the market’s discounting of
information about corporate, economic or geopolitical events – so-called “fundamentals.” If
you sit with a trader, however, it’s easy to observe that prices are always moving in response to
things other than fundamental information.
Bookstaber says, “the principal reason for intraday price movement is the demand for liquidity .
. . . In place of the conventional academic perspective of the role of the market, in which the market is efficient and exists solely for informa tional purposes, this view is that the role of the
market is to provide immediacy for liquidity demanders . . . . By accepting the notion that
markets exist to satisfy liquidity demand and liquidity supply, the framework is in place
for understanding what causes market crise s, which are the times when liquidity and
immediacy matter most.”
“Liquidity demanders are demanders of immediacy.” I would describe them as holders of assets
in due course, such as investors and hedgers, who from time to time have a strong need to adjust
their positions. When there’s urgency, “the defining characteristic is that time is more important
than price . . . . they need to get the trade done immediately and are willing to pay to do so. ”
Usually when the price of something falls, fewer people want to sell it and more want to buy it.
But in a crisis, “market prices become countereconomic,” and the reverse becomes true. “A
© Oaktree Capital Management, L.P.
All Rights Reserved 8
falling price, instead of deterring people from selling, triggers a growing flood of selling,
and instead of attracting buyers, a falling price drives potential buyers from the market
(or, even worse, turns potential buyers into sellers.)” This phenomenon can occur for
reasons ranging from transactional (they receive margin calls) to emotional (they just get
scared). The liquidity demanders increase in number, and they become more highly motivated.
In times of crisis, liquidity suppliers become scarce. Maybe they spent their capital in the first
10% decline and are out of powder. Maybe the market’s increased volatility and de creased
liquidity have reduced the price they’re willing to pay. And maybe they’re scared, too.
“Information did not cause the dramatic price volatility. It was caused by the crisis -
induced demand for liquidity at a time that liquidity suppliers were shrinking from the
market.”
Speaking of panics, we all recognize the carnage that occurs when the desire to sell far exceeds the
willingness to buy. But I think Bookstaber’s analysis applies equally to the opposite – times when
the desire to buy outstrips the willingness to sell. It amounts to a “ buying panic” and represents no
less of a crisis, even though – because the immediate result is profit rather than loss – it is discussed
in different terms. Certainly 1999 was just as much a year of irrational, liquidity-driven crisis
as was 1987.
And clearly, both selling panics and buying panics have more to do with extreme swings in
emotion and urgency than they do with fundamental corporate and economic developments .
The Credit Cycle
I couldn’t leave the subject of cycles without touching on one of the most pronounced, the credit
cycle. From time to time, providers of capital simply turn the spigot on or off – as in so many
things, to excess. There are times when anyone can get any amount of capital for any purpose, and
times when even the most deserving borrowers can’t access reasonable amounts for worthwhile
projects. The behavior of the capital markets is a great indicator of where we stand in terms of
psychology and a great contributor to the supply of investment bargains.
The level of security issuance varies over time in a wave-like pattern, and the swing from high years
to low years can be great. I don’t believe a high level of issuance says much about the desire of
companies to raise money; us ually they’ll take all that’s available. Rather, a high level of issuance
indicates a willingness on the part of investors to buy increased amounts of securities, something
that varies greatly depending on their mood.
But equally important is the trend in the quality of new issue securities. It is my belief that a
willingness to buy new securities in greater quantity invariably is accompanied by a
willingness to buy securities of lower quality . Thus lower standards go hand in hand with higher
amounts of issuance. When investors are chastened and afraid, they’ll buy very few new securities,
and only those of high quality. When they’re euphoric and confident, they’ll buy greater quantities
and attend less to matters of quality and downside protection. In the most overheated markets,
when being underinvested is considered the biggest mistake one can make, buyers compete for
new issues by paying higher prices and by demanding less in terms of quality and safety.
© Oaktree Capital Management, L.P.
All Rights ReservedIt’s
in this way that the swing of the capital market pendulum to one extreme provides the energy
for the swing back toward the other. For example, with terrified high yield bond investors hugging
the sidelines in 1990-91, low issuance and a great degree of investor selectivity set the stage for low
subsequent default rates and excellent portfolio performance. Double-digit returns in 1991-97 (save
1994) turned investors from cautious to confident and attracted increased capital for investment in
high yield bonds. These conditions led to the issuance of bonds in greater quantity and lower
quality in 1997-99. And, of course, that issuance c ontributed to record default rates in 2001-02, to
great portfolio losses, and eventually to enormous returns on the rebound. And so the cycle goes on.
From the depths reached in the summer of 2002, the recovery of investor sentiment has been
dramatic in both its extent and its speed. And with that recovery has come yet another dramatic swing of the capital cycle from restrictive to accommodating. Again as seen through the example of
high yield bonds, the last eighteen months have witnessed a near-record amount of new bond
issuance, including a large number of CCC-rated bonds, bonds with weak covenants, and bonds
issued to fund payments to equity holders.
All net debt incurrence adds to a company’s riskiness, in that it increases balance sheet leverage.
But at minimum the proceeds, or assets bought with the proceeds, should stay within the company.
When debt is raised and the proceeds go out the do or without enhancing the value of the company, a
transaction should be viewed with a particularly criti cal eye. The fact that a substantial number of
bonds-for-dividends deals could be done in recent months says a lot about where we stand in the
credit cycle . . . and about the likelihood that some of these deals will be grist for distressed debt
investment in the future.
Looking for the cause of a market extreme usually requires rewinding the videotape of the credit
cycle a few months or years. Most raging bull ma rkets are abetted by an upsurge in the willingness
to provide capital, usually imprudently. Likewise, most collapses are preceded by a wholesale
refusal to finance certain companies, industries, or the entire gamut of would-be financers.
The capital market oscillates between wide open and slammed shut. It creates the potential
for eventual bargain investments when it provide s capital to companies that shouldn’t get it,
and it turns that potential into reality when it pulls the rug out from under those companies by
refusing them further financing. It always has, and it always will.
UJust Give Me My 10%
Putting it all together, the fluctuations in attitudes and behavior described above combine to make
the stock market the ultimate pendulum. In my 34 full calendar years in the investment business,
starting with 1970, the annual returns on the S&P 500 have swung from plus 37% to minus 26%.
Averaging out good years and bad years, the long-run return is usually stated as 10% or so. Everyone’s been happy with that typical performance and would love more of the same.
But remember, a swinging pendulum may be at its midpoint “on average,” but it actually
spends very little time there. The same is true of financial market performance. Here’s a fun
question (and a good illustration ): for how many of the 34 years from 1970 through 2003 was
the annual return on the S&P 500 within plus or minus 2% of “normal” – that is, between 8%
and 12%?
© Oaktree Capital Management, L.P.
All Rights ReservedI expected the answer to be “not that often,” but I was surp
rised to learn that it had happened Uonly
once U! It also surprised me to learn that the return had been more than 20 percentage points away
from “normal” – either up more than 30% or down more than 10% – two-thirds of the time: 22 out
of the last 34 years. So one thing that can be said with conviction about stock market performance
is that the average certainly isn’t the norm. Market fluctuations of this magnitude aren’t nearly
fully explained by the changing fortunes of companies, industries or economies. They’re largely
attributable to the mood swings of investors.
Lastly, the times when return is at the extremes aren’t randomly distributed over the years. Rather
they’re clustered, due to the fact that investors’ psychological swings tend to persist for a while – to
paraphrase Herb Stein, they tend to continue until they stop. Not one of those 22 extreme up or down years was more than a year away from another year of similarly extreme performance in the
same direction .
* * *
So from time to time we see rabid buyers or terrified sellers; urgency to get in or to get out;
overheated markets or ice-cold markets; and prices unsustainably high or ridiculously low.
Certainly the markets, and investor attitudes an d behavior, spend only a small portion of the
time at “the happy medium.”
What does this say about how we should act? Joining the herd and participating in the extremes of
these cycles obviously can be dangerous to your financial health. The markets’ extreme highs are
created when avid buyers are in control, pushing pr ices to levels that may never be seen again.
The lows are created when panicky sellers predomin ate, willing to part with assets at prices
that often turn out to have been grossly inadequate.
“Buy low, sell high” is the time-honored dictum, but investors who are swept up in market
cycles too often do just the opposite . The proper response lies in contrarian behavior: buy when
they hate ‘em, and sell when they love ‘em. “Once-in-a-lifetime” market extremes seem to occur
just once in a decade or so – not often enough to build an investment career around capitalizing on
them. But attempting to do so should be an important component of any investor’s approach.
Just don’t think it’ll be easy. You need the ability to detect instances in which prices have diverged
significantly from intrinsic value. You have to have a strong-enough stomach to defy conventional
wisdom (one of the greatest oxymorons) and resist the myth that the market’s always efficient, and
thus right. You need experience on which to base this resolute behavior. And you must have the
support of understanding, patient constituencies. Without enough time to ride out the extremes
while waiting for reason to prevail, you’ll become that most typical of market victims: the six-foot tall man who drowned crossing the stream that was five feet deep on average. But if you’re alert to
the pendulum-like swing of the markets, it’s possible to recognize the opportunities that
occasionally are there for the plucking.
July 20, 2004
10
© Oaktree Capital Management, L.P.
All Rights Reserved 11
Legal Information and Disclosures
This memorandum expresses the views of the author as of the date indicated and such views are subject
to change without notice. Oaktree has no duty or ob ligation to update the information contained herein.
Further, Oaktree makes no representation, and it should not be assumed, that past investment performance is an indication of future results. More over, wherever there is th e potential for profit there
is also the possibility of loss. This memorandum is being made av ailable for educational purposes only and should not be used for any
other purpose. The information contained herein do es not constitute and should not be construed as an
offering of advisory services or an offer to sell or solicitation to buy any securities or related financial
instruments in any jurisdiction. Certain inform ation contained herein concerning economic trends and
performance is based on or derived from informatio n provided by independent third-party sources.
Oaktree Capital Management, L.P. (“Oaktree”) believes that the sources from which such information has been obtained are reliable; however, it cannot g uarantee the accuracy of su ch information and has
not independently verified the accuracy or complete ness of such information or the assumptions on
which such information is based.
This memorandum, including the information cont ained herein, may not be copied, reproduced,
republished, or posted in whole or in part, in an y form without the prior written consent of Oaktree.
Recommended Reading
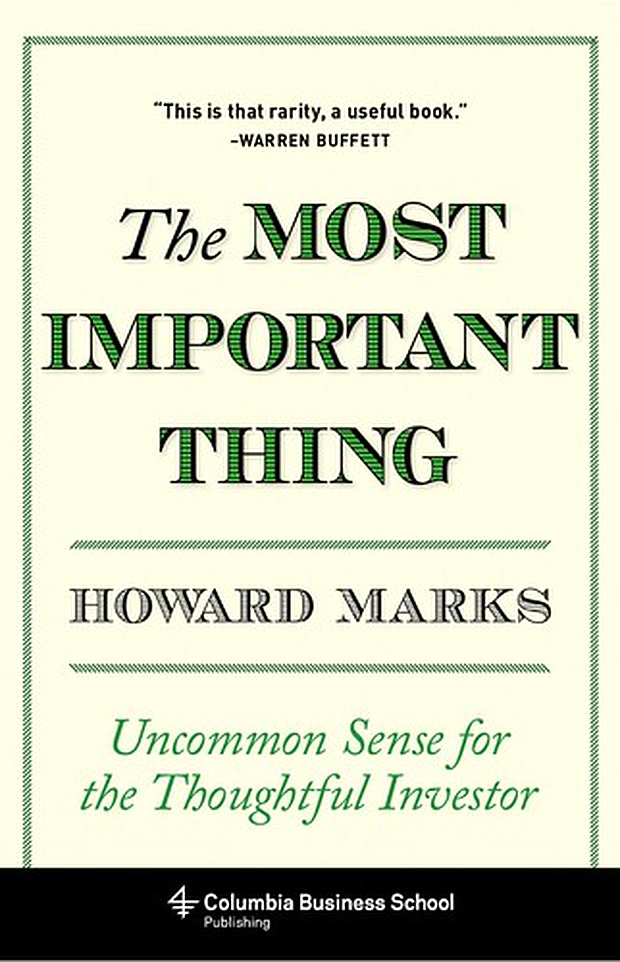
The Most Important Thing
Get on Amazon →
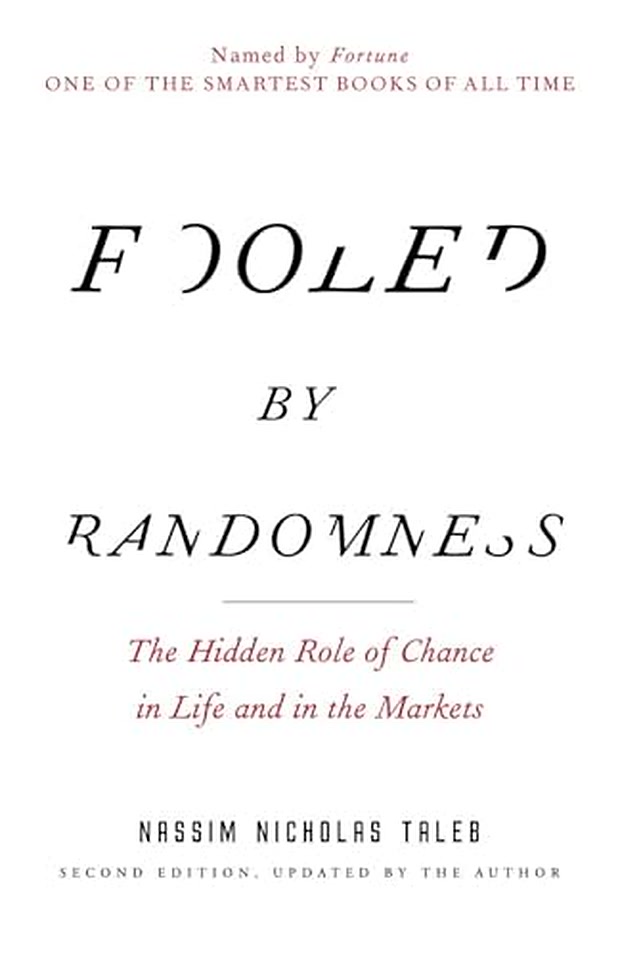
Fooled by Randomness
Get on Amazon →
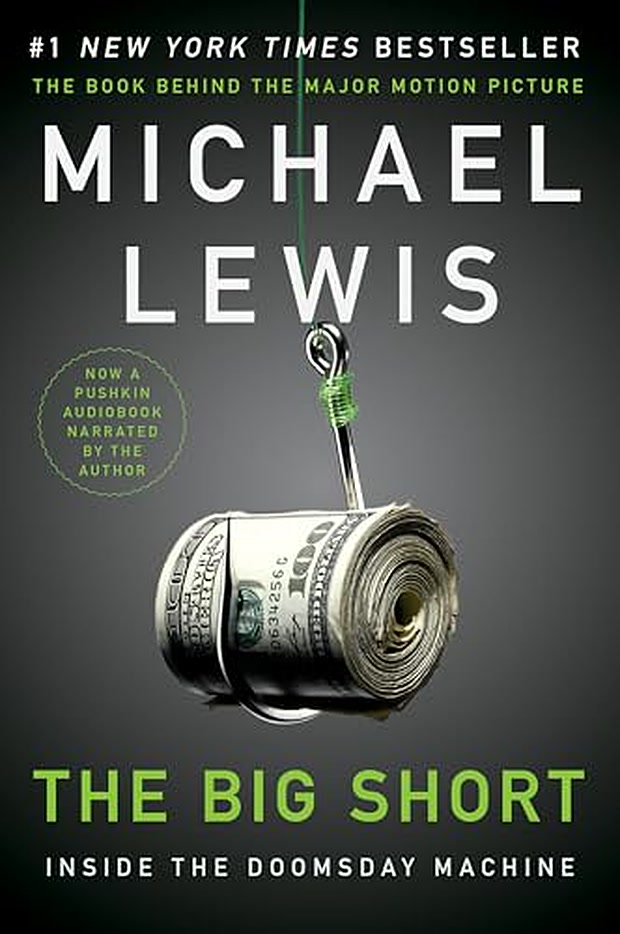
The Big Short
Get on Amazon →
As an Amazon Associate I earn from qualifying purchases.