Howard Marks
1996 07 22 The Value Of Predictions Ii Or Give That Man A Cigar
© Oaktree Capital Management, L.P.
All Rights ReservedMemo To: Oaktree Clients
From: Howard Marks
Re: The Value of Predictions II (or "Give That Man a Cigar")
Date: July 22, 1996
In a February 1993 memo entitled "The Value of Predictions," I expressed my negative opinion of
attempts to predict the macro-future. Now, to follow up, I've examined a handful of semi-annual
Wall Street Journal economic surveys I've been stashing away. Please note that this was not a
scientific study; my sample was limited to the contents of my desk drawer. The conclusions are
interesting nevertheless.
First , can accurate forecasts be made? The record shows the predictions of the Journal's
average "expert" to have added little value in te rms of predicting the future. The table below
shows the wide margin by which th e consensus missed the mark.
U90-day bill rate U30-year bond rate UYen/$
December '93
12-Month Prediction 3.7% 6.4% 115 December '94 Actual 5.7 7.9 100
December '94
6-Month Prediction 6.5 7.9 104
June '95 Actual 5.4 6.6 85
December '94
12-Month Prediction 6.4 7.6 107
December '95 Actual 5.1 5.9 103
June '95
6-Month Prediction 5.4 6.6 89
December '95 Actual 5.1 5.9 103
June '95
12-Month Prediction 5.3 6.6 92
June '96 Actual 5.2 6.9 110
December '95
6-Month Prediction 4.9 6.0 105
June '96 Actual 5.2 6.9 110
© Oaktree Capital Management, L.P.
All Rights ReservedOn average, these predictions were off by 15%. In the three sets of half-year data I had
available, the average expert forecaster couldn't even get closer than 96 basis points when
attempting to predict the level of long rates six months out! And missing long rates by 96 basis
points implies missing the price of the $1000 long bond by $120.
Second, are these forecasts of any value? My limited survey shows the average forecast
published by the Journal has not been helpful. The key isn't whether the forecasters accurately
predicted the level of the parameters but, (since you make money by anticipating change), whether
they were right about the likelihood of significant change and its direction . That these forecasts
weren't of value can be seen clearly in the follo wing table, which looks at changes rather than
levels.
U90-day bill rate U30-year bond rate UYen/$
December '93 12-Month
Predicted Change + 60 b.p. + 10 b.p. +3
Actual Change +260 b.p. +160 b.p. -12
December '94 6-Month
Predicted Change + 80 b.p. --0-- +4
June '95 Actual - 30 b.p. -130 b.p. -15
December '94 l2-Month
Predicted Change + 70 b.p. - 30 b.p. +7
December '95 Actual - 60 b.p. -200 b.p. +3
June '95 6-Month
Predicted Change --0-- --0-- +4
December '95 Actual - 30 b.p. - 70 b.p. +18
June '95 l2-Month
Predicted Change - 10 b.p. --0-- +7
June '96 Actual - 20 b.p. + 30 b.p. +25
December '95 6-Month
Predicted Change - 20 b.p. + 10 b.p. +1
June '96 Actual --0-- +100 b. p. +7
As the table shows, it's not that the forecasters were always wrong; when there was little change, they were often right. It's just that in times of major changes, (when accurate forecasts would've
helped one make money or avoid a loss), the fo recasters completely missed them. In the years
reviewed, the expert consensus failed to predict all of the major developments. Included here are
interest rate increases of 1994 and 1996, the rate d ecline of 1995, and the massive gyrations of the
dollar/yen relationship. In summary, there simply hasn't been much correlation between predicted
changes and actual changes.
© Oaktree Capital Management, L.P.
All Rights ReservedThird, where do these forecasts come from? The answer is simple: If you want to see a high
correlation, take a look at the relationship between current levels and predicted future levels.
The table below, which does just that, shows a remarkably better "fit."
U90-day bill rate U30-year bond rate UYen/$
December '93 Actual 3.1% 6.3% 112
12-Month Prediction 3.7 6.4 115
December '94 Actual 5.7 7.9 100
6-Month Prediction 6.5 7.9 104
December '94 Actual 5.7 7.9 100
12-Month Prediction 6.4 7.6 107
June '95 Actual 5.4 6.6 85
6-Month Prediction 5.4 6.6 89
June '95 Actual 5.4 6.6 85
l2-Month Prediction 5.3 6.6 92
December '95 Actual 5.1 5.9 103
6-Month Prediction 4.9 6.0 105
Now that's a correlation! On average, the predictions were within 5% of the levels which
prevailed at the time they were made. When rates were low, the experts predicted that they would
stay low; after rates rose, they were expected to stay high. High dollar/yen exchange rates brought
high dollar/yen forecasts, and vice versa. Ther e's no question about it: each consensus forecast
represented a near-extrapolation of then-current levels. Like many forecasters, these economists
were driving with their eyes firmly fixed on the rearview mirror.
On the one occasion, in 1994, when the consensu s of forecasters was bold enough to venture a
prediction for short rates which di ffered substantially from the then-c urrent levels, they got even
the direction of the subsequent change wrong. The probl em is that, rather than extrapolate the
year-end 1994 level, they extrapolated the 1994 trend, which reversed in 1995.
In general, we can say with certainty that these forecasters were much better at telling us
where things stood than where they were going. This bears out the old adage that "it's
difficult to make accurate prediction s, especially with regard to the future ." The
corollary is also true: predicting the past is a snap.
And using the prevailing levels to predict the future would have been just about as effective as
the average forecast. The prevailing levels diffe red from the future levels by 16% on average,
while the consensus prediction erred by 15%.
© Oaktree Capital Management, L.P.
All Rights ReservedFourth, can't anyone get it right? It is absolutely not true that nobody makes accurate
forecasts. Every six months, when the Journal re ports on a new survey of forecasts, it takes the
opportunity to cite the forecaster in the prev ious survey who came closest to accurately
predicting the three financial indicators shown above plus the change in GNP and CPI. It prints
the winner's picture and lauds the unique insights which led to the accurate forecasts.
And the truth is that the winner's accuracy is of ten startling, as shown in the following table with
regard to what we consider the most important of the indicators, the interest rate on the 30-year
Treasury bond. Each time, the winner's forecast was quite close to the actual and much more
accurate than the consensus.
Susan Sterne James Smith Michael Cos grove
Economic Anal. Assoc. Univ. of No. Caro. The Econoclast
UDecember 1994 UJune 1995 UDecember 1995
Winner's Prediction 6.80% 6.05% 6.90%
Subsequent Actual 6.62 5.94 6.89
Consensus Prediction 7.92 6.60 6.00
Looking at the winning forecasters' results shown above, one might even be tempted to
conclude that accurate predictions are in fact achievable.
Fifth, then why do I remain so negative on forecasters' ability? The important thing isn't
getting it right once. It's doing so consistently.
The table below shows two things that might make you think twice about heeding the winners'
forecasts. First, they generally failed to make a ccurate predictions in su rveys other than the one
they won (shown in bold). And second, in the su rveys they didn't win, their forecasts were much
more wrong than even the inaccurate consensus half the time.
UDecember 1994 UJune 1995 UDecember 1995
Susan Sterne 6.80% 6.00% 5.00%
James Smith 7.40 6.05 5.55
Michael Cosgrove 7.50 7.70 6.90
Consensus Prediction 7.92 6.60 6.00
Subsequent Actual 6.62 5.94 6.89
As the Journal itself pointed out in reviewing the results of the December 1995 survey:
. . .by giving up the comfort of the consensus, those on the fringes of the
economic prediction game of ten end up on the winning or losing end. James
Smith of the University of North Carolina and Susan Sterne of Economic
Analysis Associates, the winners six months and one year ago, respectively, didn't even get the direction of interest rates right this time. The same
happened last year to
© Oaktree Capital Management, L.P.
All Rights ReservedWayne Angell of Bear, Stearns Securities Corp., the winner before them ....
(Emphasis added)
An interesting pattern emerges from the data show n above. In all three surveys, Ms. Sterne's
prediction was the lowest of the three experts and Mr. Cosgrove's was the highest. One way to
get to be right is to always be bullish or al ways be bearish -- if you hold a fixed view long
enough, you may be right sooner or later. And if you're always an outlier, you're likely to
eventually be applauded for an extremely unconve ntional forecast that correctly foresaw what no
one else did. But that doesn't mean your forecasts are regularly of any value.
A lot of adages fit this data. I've heard it said that "even a blind squirrel occasionally finds an
acorn," "a stopped clock is right twice every da y" and "if you put enough monkeys in a room
with typewriters, eventually one of them will write the Bible."
I feel the sum of this data shows that it's possi ble to be right about the macro-future once in a
while, but not on a regular basis. It doesn't do any good to possess a survey of 64 forecasts that
includes a few which are accurate; you have to kn ow which ones they are. And if the accurate
forecasts each six months are made by different economists, it's hard to believe there's much
value in the collective forecasts.
By the way, there's an important analogy to be drawn here: Efficient market advocates don't say
it's impossible to beat the market; lots of people do it every year. (Remember, half the
observations in any sample are above the median.) They only assert that no one can consistently
do so in risk-adjusted terms.
Finally, can macro-forecasts be used to gain an advantage? I pointed out in my 1993
memo that most of the time, you can't get superior results with inaccurate forecasts or with
accurate forecasts that reflect the consensus. (This is because the consensu s view of the future
is already embedded in the price of an asset at the time you buy it). To bring above average
profits, a forecast generally must be different from the consensus and accurate.
But, as I described in 1993, it's difficult with rega rd to a non-consensus view of the future (1) to
believe in it, (2) to act on it, (3) to stand by it if the early going suggests it's wrong, and (4) to be
right. Those who invest based on fringe predic tions are often wrong to an embarrassing and
costly extent.
At Oaktree, we don't spend our time attempting to guess at the future direction of economies,
rates and markets, things about which no one seems to know more than anyone else. Rather, we
devote ourselves to specialized research in ma rket niches which others find uninteresting,
unseemly, overly complicated, beyond their compet ence or not worth the effort and risk. These
are the inefficient markets in which it is possible to gain a "knowledge advantage" through the expenditure of time and effort. They also happe n to be markets in which micro factors relating
to companies, assets and securities matter the most . This is where it's possible to find bargains,
and only bargain purchases can be counted on to dependably lead to returns which are above-
average relative to the risk entailed. We say " we try to know the knowable" -- and that
doesn't include the macro-future.
© Oaktree Capital Management, L.P.
All Rights ReservedLegal Information and Disclosures
This memorandum expresses the views of the author as of the date indicated and such views are
subject to change without notice. Oaktree has no duty or obligation to update the information contained herein. Further, Oaktree makes no rep resentation, and it should not be assumed, that
past investment performance is an indication of future results. Moreover, wherever there is the
potential for profit there is also the possibility of loss. This memorandum is being made available for educational purposes only and should not be used
for any other purpose. The information contai ned herein does not constitute and should not be
construed as an offering of advisory services or an offer to sell or solicitation to buy any
securities or related financial instruments in any jurisdiction. Certain information contained herein concerning economic trends and performan ce is based on or derived from information
provided by independent third- party sources. Oaktree Capita l Management, L.P. (“Oaktree”)
believes that the sources from which such informa tion has been obtained are reliable; however, it
cannot guarantee the accuracy of such inform ation and has not independently verified the
accuracy or completeness of such information or the assumptions on which such information is
based. This memorandum, including the information cont ained herein, may not be copied, reproduced,
republished, or posted in whole or in part, in any form without the prior written consent of
Oaktree.
Recommended Reading
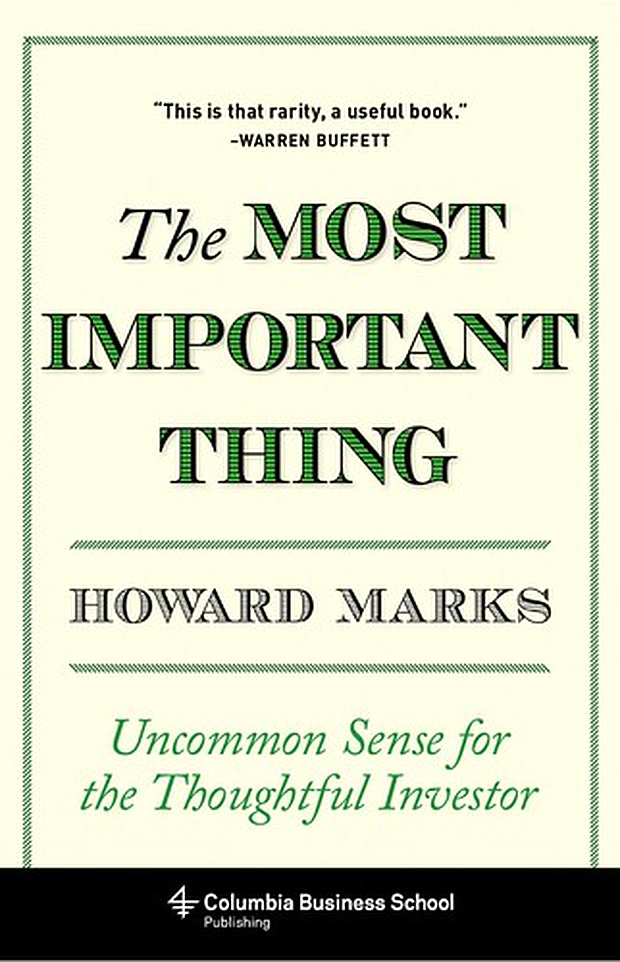
The Most Important Thing
Get on Amazon →
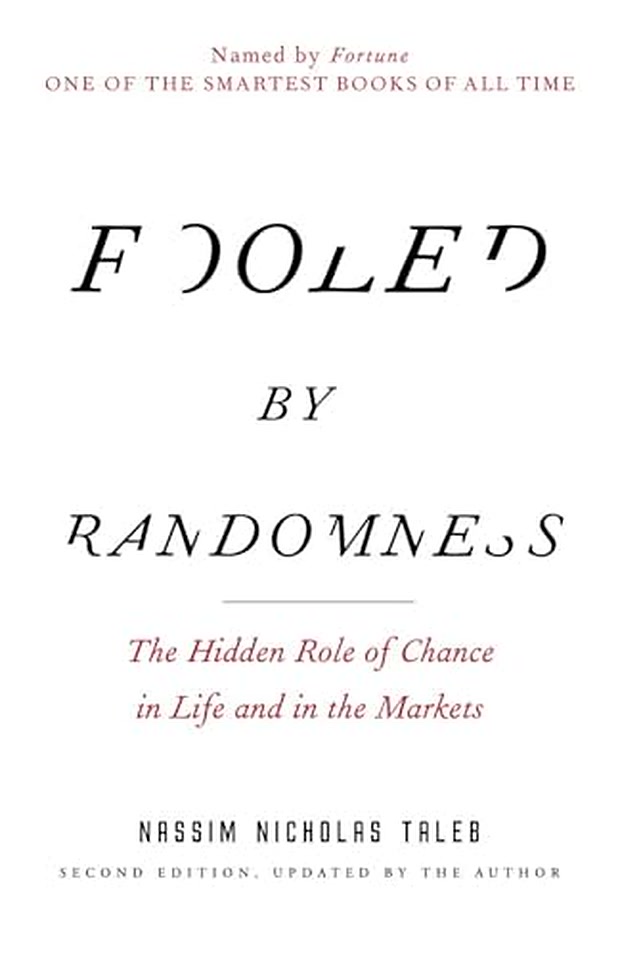
Fooled by Randomness
Get on Amazon →
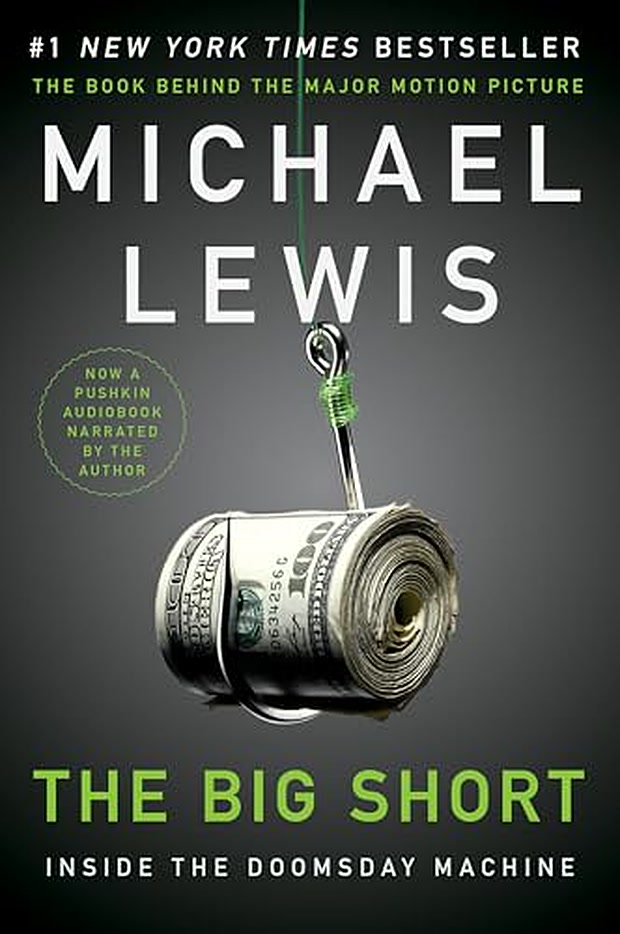
The Big Short
Get on Amazon →
As an Amazon Associate I earn from qualifying purchases.